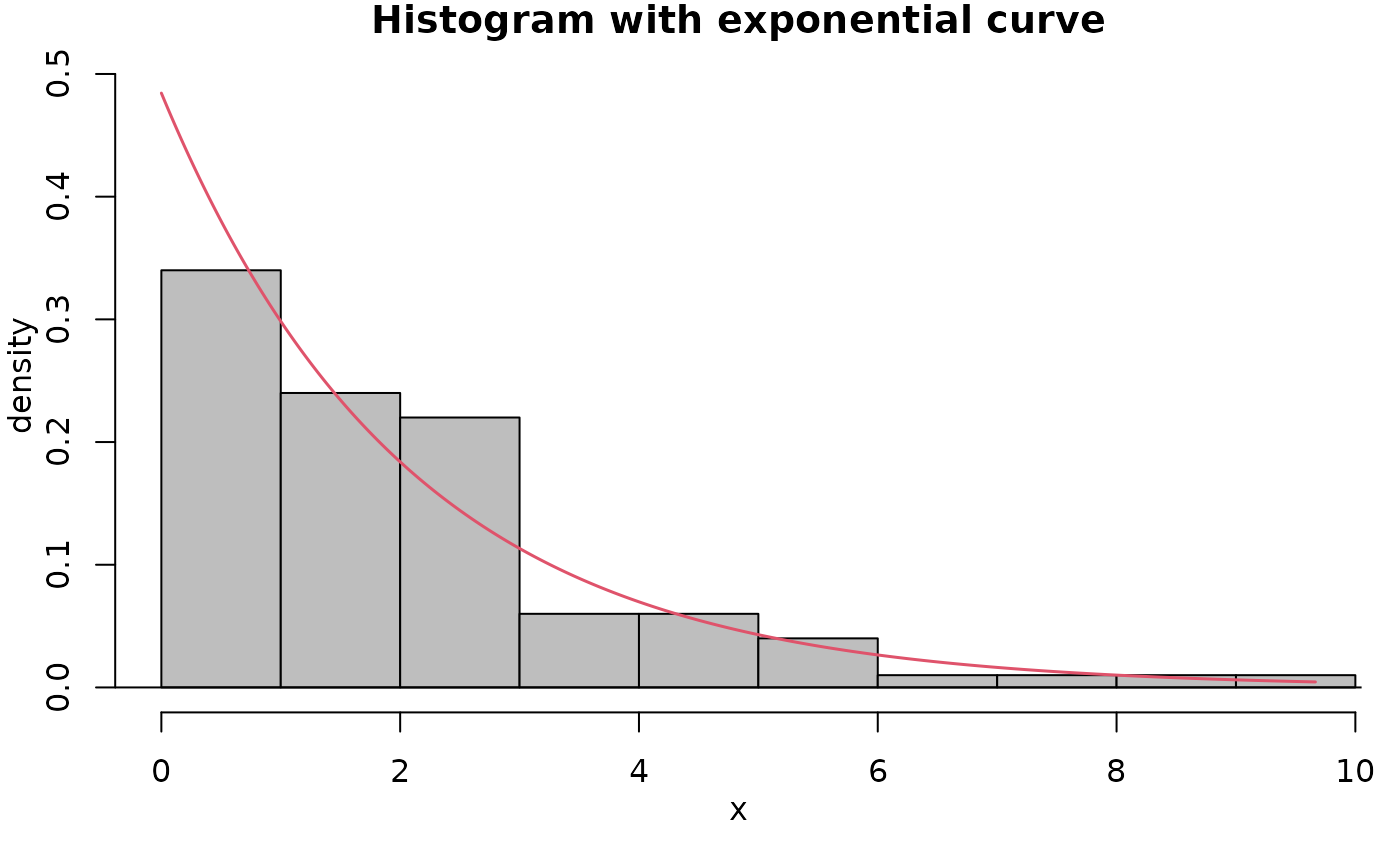
addexp creates a histogram of x and overlays an exponential density
function with \(\lambda = \frac{1}{mean}\).
Usage
addexp(
  x,
  main = "Histogram with exponential curve",
  xlab = deparse(substitute(x)),
  bins = NULL
)
Arguments
- x
A numeric vector representing the data to be plotted.
- main
Optional title for the plot
- xlab
Optional x-axis label for the plot
- bins
Optional number of bins for the histogram.
Value
A histogram of x overlayed with an exponential density function.
Examples
set.seed(0)
x <- rexp(100, rate = 0.5)
addexp(x)
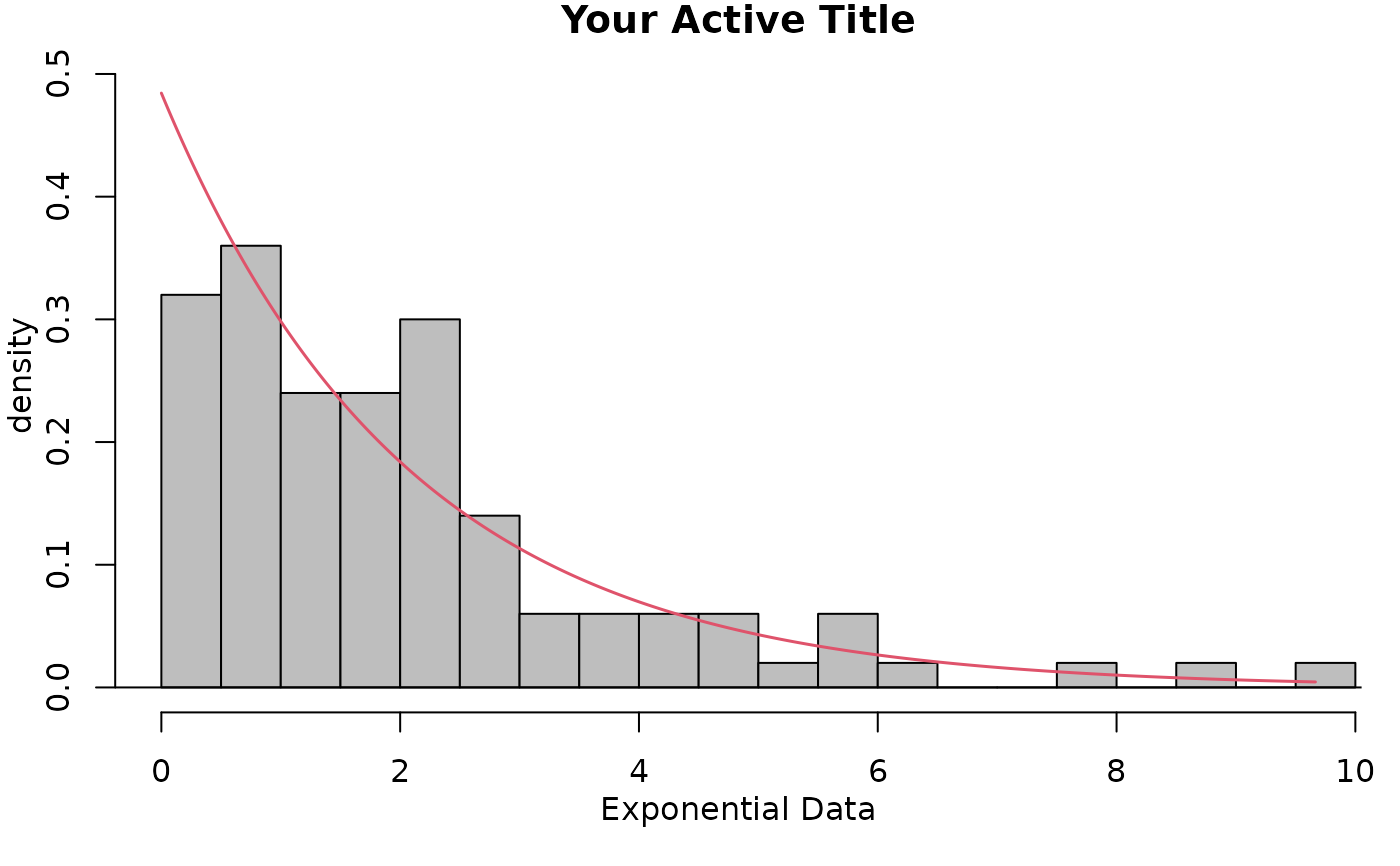
 addexp(x, main = "Your Active Title", xlab = "Exponential Data", bins = 20)