addlnorm creates a histogram of x and overlays a log normal density function.
Usage
addlnorm(
  x,
  main = "Histogram with log-normal curve",
  xlab = deparse(substitute(x)),
  bins = NULL
)
Arguments
- x
A numeric vector representing the data to be plotted.
- main
Optional title for the plot
- xlab
Optional x-axis label for the plot
- bins
Optional number of bins for the histogram.
Value
A histogram of x overlayed with an log normal density function.
Examples
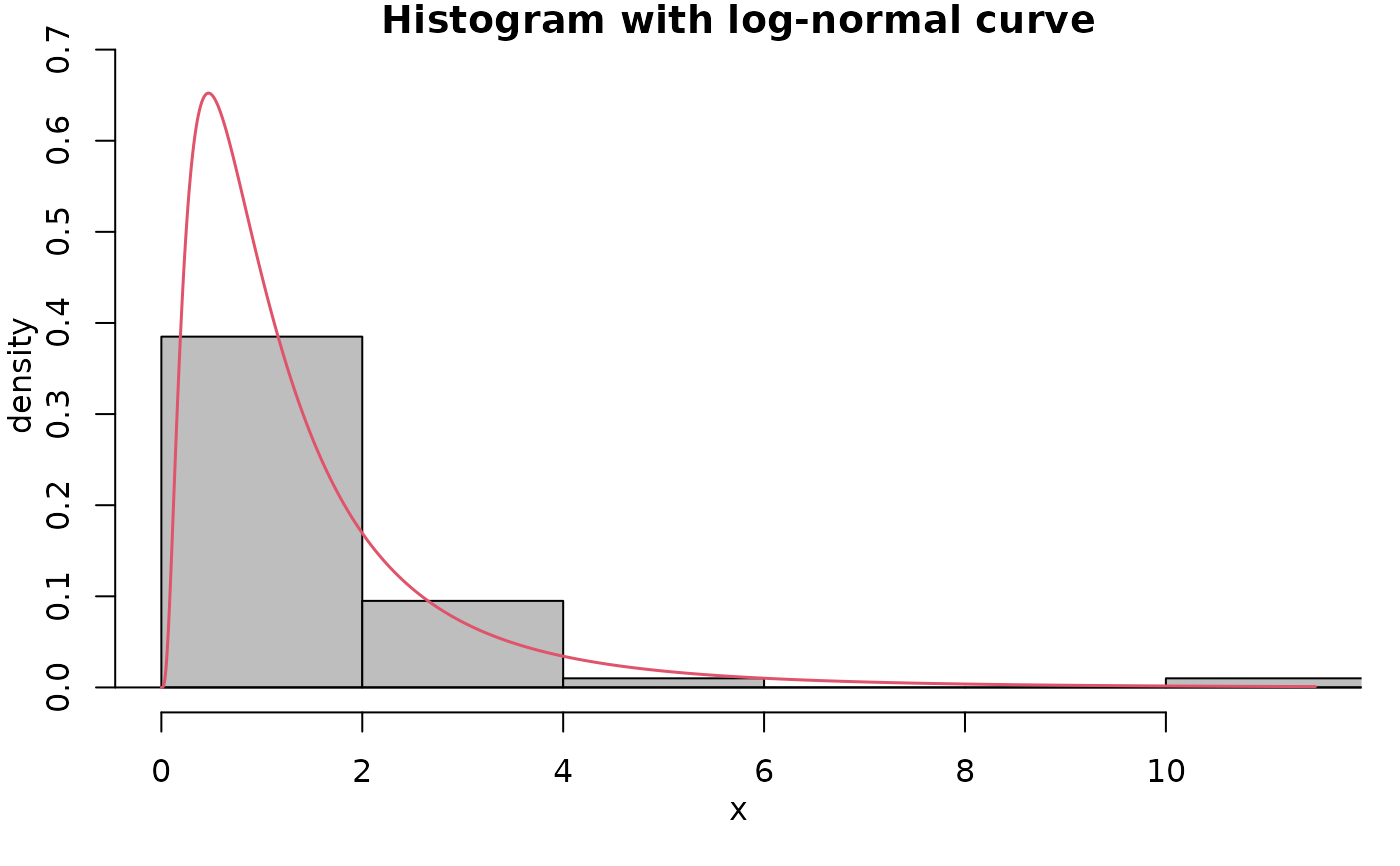
set.seed(0)
x <- rlnorm(100)
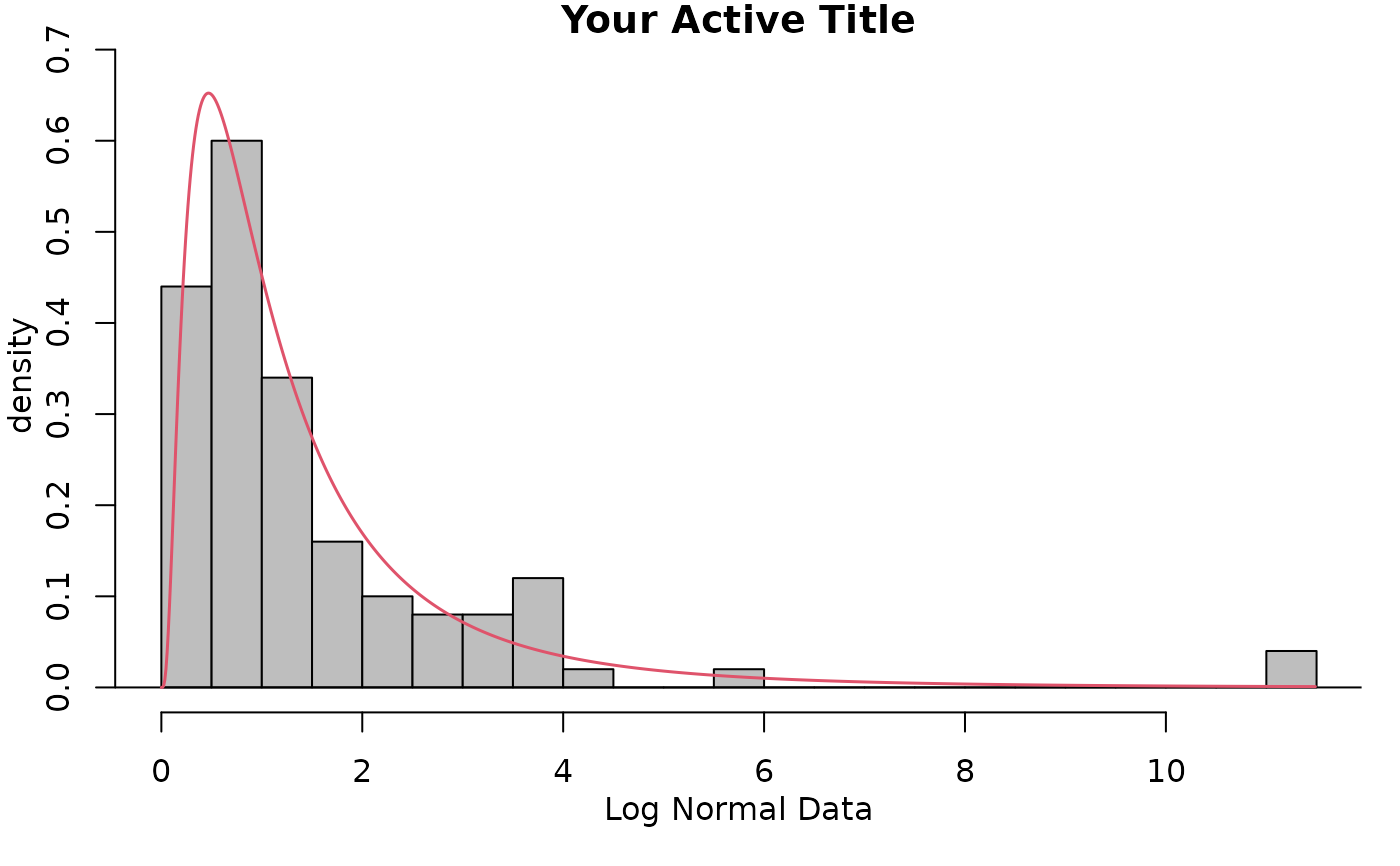
addlnorm(x)
 addlnorm(x, main = "Your Active Title", xlab = "Log Normal Data", bins = 20)