boxplot plots the given data in a box plot. If a second categorical variable
is given, the data is grouped by this variable.
Usage
boxplot(
  response,
  explanatory = NULL,
  main = "",
  xlab = "",
  ylab = substitute(explanatory)
)
Arguments
- response
Vector of numeric values to plot.
- explanatory
Optional second categorical variable to group by.
- main
Optional title for the plot
- xlab
Optional x-axis label for the plot
- ylab
Optional y-axis label for the plot. Only displayed when explanatory is provided.
Examples
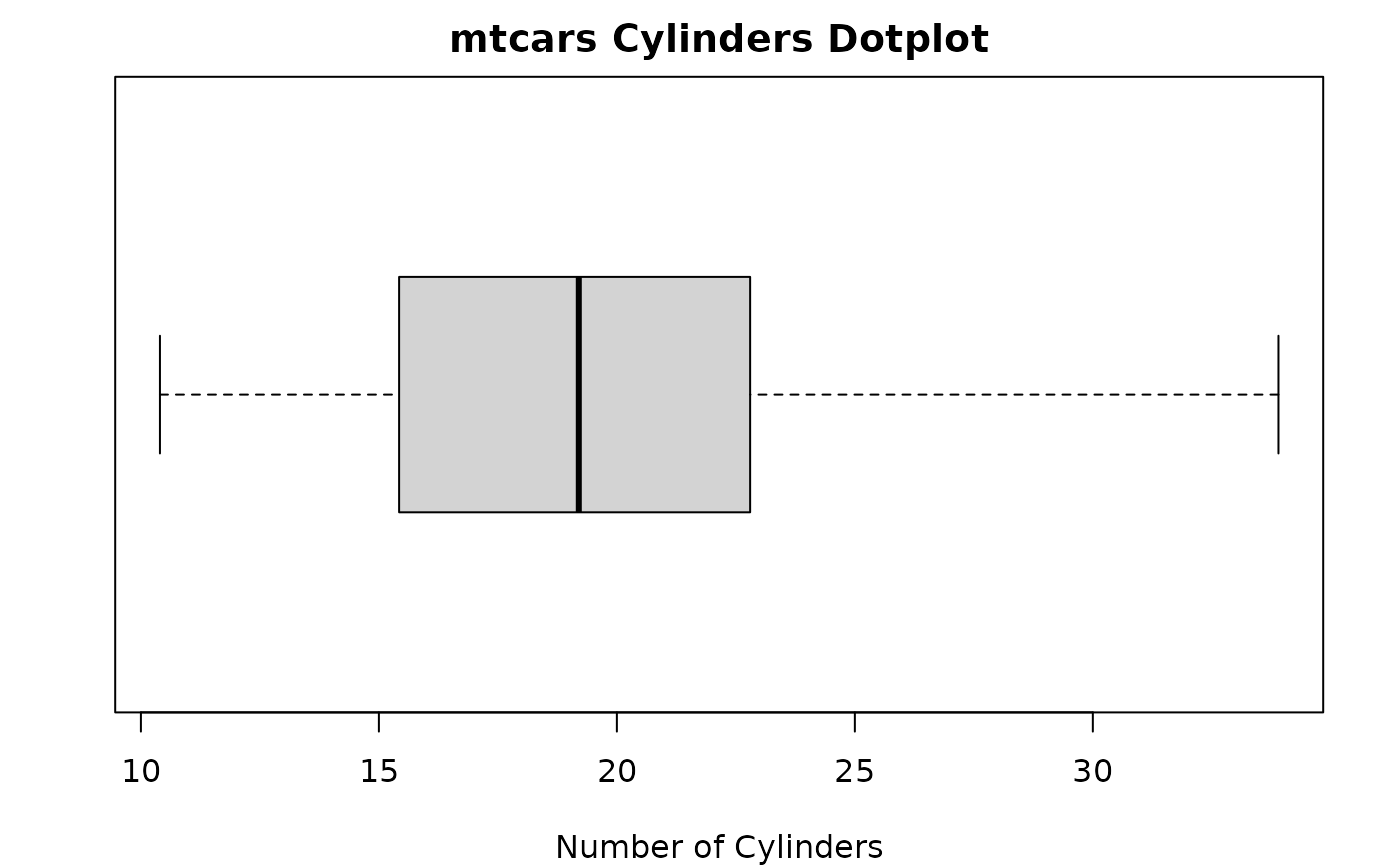
boxplot(
mtcars$mpg,
main = "mtcars Cylinders Dotplot",
xlab = "Number of Cylinders"
)
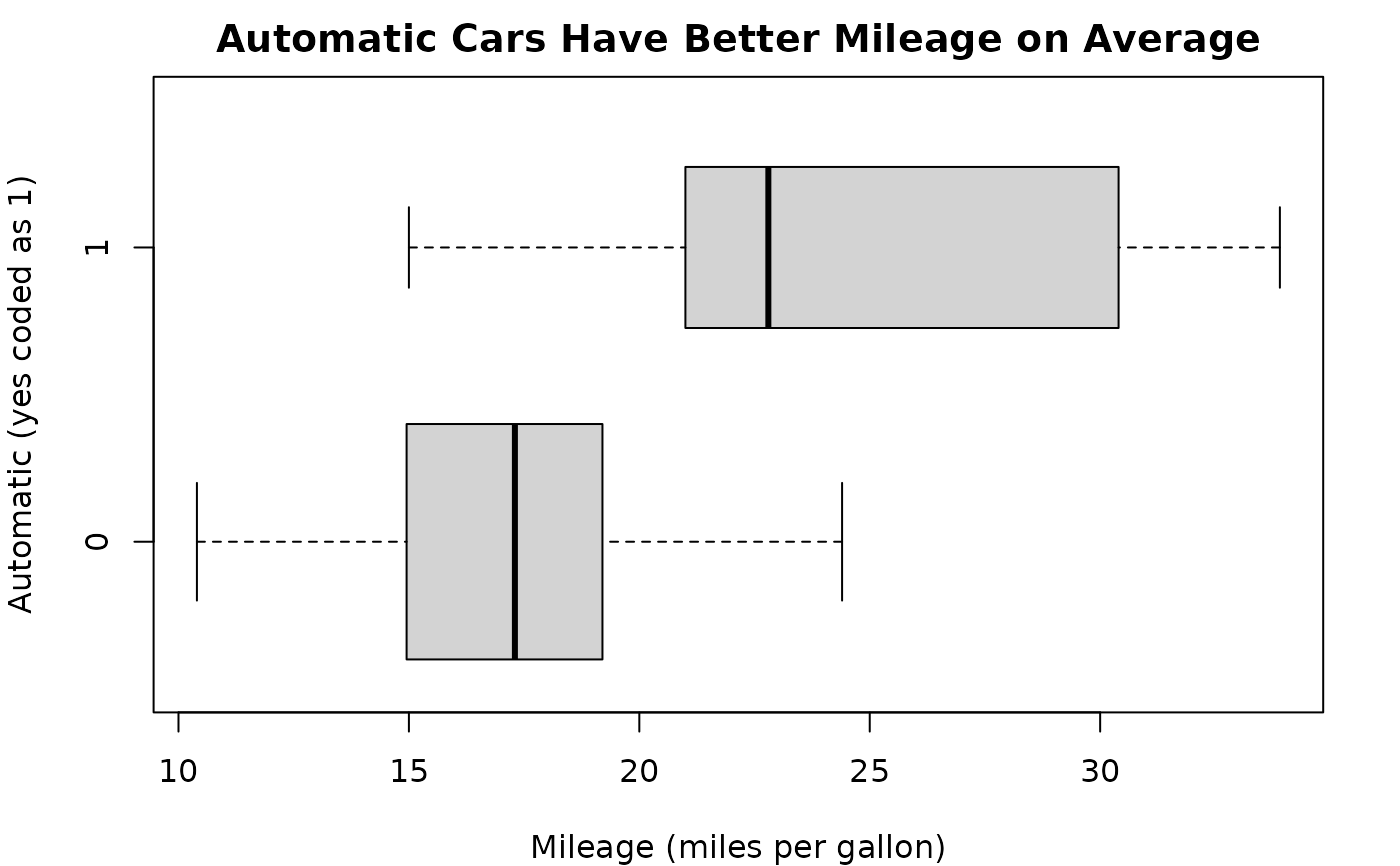
 boxplot(
mtcars$mpg,
mtcars$am,
main = "Automatic Cars Have Better Mileage on Average",
xlab = "Mileage (miles per gallon)",
ylab = "Automatic (yes coded as 1)"
)
boxplot(
mtcars$mpg,
mtcars$am,
main = "Automatic Cars Have Better Mileage on Average",
xlab = "Mileage (miles per gallon)",
ylab = "Automatic (yes coded as 1)"
)